APAC CIO Outlook | 8 AWS Do's and Don'ts Learned from 8 Years Scaling Across 20 Countries and 300 Serviers

Originally posted on APAC CIO Outlook website. Refer to this link to read full article.

by Howard Lince III, Director of Enginerring, LenddoEFL

Howard+v2.jpg

At LenddoEFL, we work at the intersection of big data, machine learning, and financial inclusion in emerging markets. Each of these imply a level of server sophistication that would be cripplingly difficult without Amazon Web Services (AWS). Our mission is to provide one billion people access to powerful financial products at a lower cost, faster and more conveniently. We use AI and advanced analytics to bring together the best sources of digital and behavioral data to help lenders in emerging markets confidently serve underbanked people and small businesses. To date, we have provided credit scoring, verification and insights products to 50+ financial institutions, serving seven million people. We’ve been able to manage all of this with a team of three infrastructure engineers managing 300+ servers. Read full article.

Blog | The LenddoEFL Assessment Part 2: Measuring how people answer questions with metadata

By: Jonathan Winkle, Manager of Behavioral Sciences, LenddoEFL

The last post showed how our psychometric content reveals people’s personality traits, but our assessment also captures an abundance of metadata. Metadata is information about how people process the questions and exercises they complete. Here are some examples.

  • How long did an applicant take to answer a question compared to their average response time?

  • How many times did an applicant change their mind and switch their response before submitting their answer?

  • Is the applicant’s information consistent with their written request to the financial institution? (e.g., requested loan amount)

By measuring metadata, LenddoEFL’s approach goes beyond what is possible in traditional credit applications to reveal more information about applicants. Consider the following question from our test:

Which BLUE person is most like you?

image10.jpg

For this question, we consider how long it took the applicant to slide to one answer or another and whether they changed their opinions in the middle. Someone who is confident that they are an organized person should move the slider in only one direction and relatively quickly. Quick, smooth answers belie confidence, whereas slow, wavering responses demonstrate uncertainty.

The relationship between response time and default rate can be complex. Consider another psychometric exercise:

image7.png
image2.png

In this case response time was a non-linear predictor of default, where both slow and fast response times were associated with a greater credit risk!

There are many ways to interpret response time metadata. If an applicant answers a question quickly, are they confident or are they cheating? If they are taking a long time to respond, are they having difficulty understanding the question or putting extra effort into getting their answer right? By collecting metadata across all questions, we can compare a single response time to the applicant’s overall response time distribution to differentiate things like confidence and cheating (see graph below).

An example distribution of response times generated from artificial data

An example distribution of response times generated from artificial data

Conclusion

Metadata reveals another layer of behavior on top of the personality traits we target and can be used to identify features such as confidence, cheating, and confusion. These behavioral traits can be used for predicting default and ensuring that we are collecting high quality data for our models.


Blog | The LenddoEFL Assessment Part 1: Using psychometrics to quantify personality traits

By: Jonathan Winkle, Manager of Behavioral Sciences, LenddoEFL

At LenddoEFL, we collect various forms of alternative data to help lenders verify identities, analyze credit risk, and better understand an individual. One of our most important tools for financial inclusion is our psychometric assessment. While some people still lack a robust digital footprint, everyone has a psychological profile that can be characterized and used for alternative credit scoring.

In this series of posts, we shed light on the science behind the LenddoEFL psychometric assessment and how we’ve pioneered an approach to measure anyone’s creditworthiness.

Psychometrics for credit assessment

LenddoEFL employs a global research team to ensure our assessment captures the most important personality traits that predict default. We deliver innovative psychometric content by combining insights from leading academics with years of in-house research and development.

Each question in our assessment is targeted to reveal psychological attributes related to creditworthiness. We quantify behaviors and attitudes such as individual outlook, self-confidence, conscientiousness, integrity, and financial decision-making in order to build an applicant’s psychometric profile. By comparing this profile to others in the applicant pool, we can better understand and predict an individual’s likelihood of default.

Psychometric example content: Financial Impulsivity

The marshmallow test asks children whether they would you like one marshmallow now or two marshmallows later, and since its advent, psychologists have recognized that the ability to delay rewards is an important predictor of later success in life.

While adults might not long for marshmallows the same way children do, a similar test can be performed using financial rewards, and research shows that people who are better at delaying rewards are less likely to default on their loans.

Drawing from this research, we ask applicants which of two options they would prefer, a smaller sooner amount of money, or a larger later amount (see image below). Asking people for their preferences across a range of monetary values and temporal delays reveals a quantitative profile of their financial impulsivity, which is indicative of their likelihood to repay debts (If you’re curious about how we deal with people trying to cheat or game the assessment, please see this blog post on our Score Confidence algorithm)

Which do you prefer?

image11.jpg

Psychometric example content: Locus of Control

When times get tough, some people believe they can take action to overcome hardships while others believe that the challenges they face are altogether out of their hands. Those who believe their lives are governed by outside forces, an external Locus of Control, are more risk-averse and have more difficulty managing their credit.

We ask applicants to rate their agreement with a battery of statements measuring their Locus of Control, such as “My life is mostly controlled by chance events,” and “It is mostly up to luck whether or not I have many friends.” By asking these types of questions, we can precisely quantify someone’s Locus of Control along a spectrum of internal-to-external and use this data to predict default.

Conclusion

LenddoEFL delivers an innovative psychometric assessment by combining evidence from academia with active, internal research and development.  The examples above demonstrate how we quantify certain personality traits, and the myriad exercises we use in the field allow us to produce a rich psychological profile that is predictive of credit risk. In the next post we will explore the concept of metadata, which will show that how people answer psychometric questions is just as important as the answers themselves.

Press Release | LenddoEFL Launches eKYC Solution to Speed Up Verification in the Philippines

zany-jadraque-373625-unsplash.jpg

Aligned with Philippine banking regulation, technology-aided verification from LenddoEFL can help more people get faster, more convenient access to financial services.

MANILA, PHILIPPINES (PRWEB) AUGUST 28, 2018

LenddoEFL, whose verification, credit scoring, and consumer insights helps leading banks make data-driven decisions, launched an electronic Know Your Customer (eKYC) product for customers applying for credit card and bank accounts at Philippine financial institutions consistent with Bangko Sentral ng Pilipinas (BSP) regulation.

To date, Know Your Customer (KYC) regulations in the Philippines have always required a face-to-face or real-time online interview to onboard new-to-card or new-to-bank current account/savings account (CASA) customers.

Now, customers will be able to get verified as part of a CASA or credit card account application faster and more conveniently by opting-in to avail of the eKYC solution from their mobile phone. LenddoEFL’s eKYC solution offers a simpler way for banks to onboard new customers. See BSP Circular 950, Subsection X806.2 item D for details on using information and communication technology (ICT) in the conduct of face to face contact.

“This is a game-changer as we continue to adopt alternative digital verification and scoring to help push for a more secure, faster and reliable verification process to onboard more unbanked and underserved segments into the financial system, supporting BSP's mission of financial inclusion,” said Judith Dumapay, APAC Sales Director Philippines, LenddoEFL.

Each bank considering to use technology-aided verification must do so within their risk-based customer acceptance policies and anchored on the results of their risk assessment process. They also remain responsible for watchlist screening.

Read in PRWeb.com

CFI.Org | Aim. Build. Leverage. Partner. Persevere: 5 Tips to Leverage Alternative Data to Bank the Unbanked

Alternative data can help FSPs reduce loan defaults and speed up the approval process, but pitfalls exist

Written by Rodrigo SanabriaLenddoEFL


bernard-hermant-592731-unsplash.jpg

I have been rolling out alternative data initiatives for financial inclusion across Latin America for several years. At some point, my clients ask: “is this going to work?” My usual answer is “I’ve failed enough times to have figured this out.”

This is a fairly new and not completely mature field. LenddoEFL has been doing this for over 10 years. While there is still a lot to learn, my team and I can share some wisdom.

In response to Accelerating Financial Inclusion with New Data, I recently wrote about the promise and challenge of using alternative data to bank the unbanked. We’ve learned a lot about applying alternative data and have identified five key success factors:


1. Aim at the pain
2. Build on top of your current business
3. Leverage the best data source for you
4. Partner with somebody that can handle multiple data sources
5. Persevere. Capture low-hanging fruit without losing sight of the big prize

We will tackle one at a time.

1. Aim at the pain

Some financial institutions come to us interested in “trying out” alternative data. Our usual question is “what problem are you trying to solve?” Sometimes they are not clear about what they want to solve, and sometimes they want to fix too many things at the same time. The whole approach for the initiative will depend on this understanding. Choose one pain, focus on it, and build the KPIs to measure success according to this.

Keep repeating to everybody the pain you are attempting to solve to make sure everybody shares the same understanding.

These are some examples from our experience:

• An MFI wanted to increase productivity per loan officer while maintaining default rates: reduce turn-around-time, workload in the field, and complexity. Its client base was made up of unbanked and thin-file customers, so, automation based on traditional scores was not an option. Solution: Collect psychometric information for credit scoring which would allow a centralized, automated process.

• A non-traditional microlender wanted to obtain early warnings of clients that would likely fall in arrears on their next installment so that they could better focus pre-emptive collections efforts. By combining traditional repayment data with Android phone data, we are able to “rank” clients by the probability of next payment default. Now they can focus on the the one-third that will create 75 percent of the defaults.

• A traditional financial institution was turning down about one-third of applicants due to lack of credit history, and not belonging to the “right” demographics. They decided to invite “rejects” to re-apply by providing psychometric information, which allowed us to “rescue” about half of those prospects without increasing the default rate.

• A home appliances retailer providing $200 loans to consumers was losing clients due to the time required to verify their identity. By leveraging social network data, they have been able to reduce the approval turnaround time from two days to a few minutes in most cases. They have been able to approve more clients, reduce the cost of identity verification, and reduce cases of fraud.

2. Build on top of your current business

A good friend and a brilliant risk professional called me asking for help: “We are planning to launch a new product, for a new segment, in a new channel, so we need to use a new source of data to build an origination model.”

“Too many ‘news’ in the equation,” I told him. However, I joined his new venture.

You can guess how this adventure ended: slow volume uptake, lack of an actionable model after several months, and little enthusiasm to keep investing in order to capture value.

As we discussed in the first post, building models with alternative data is a numbers game. You need volume.

In the successful cases we mentioned before, we collected alternative data from a population that was already being served through a channel already established. This was to support a product with existing traction in the business. Innovation was concentrated in the data source and methodology to asses risk.

3. Leverage the best data source for you

Each source of data has advantages and drawbacks. In the front end, some sources may create more or less friction on the client onboarding, depending on origination processes. On the backend, usually the “low-friction” data is not structured. Unstructured data is not organized in a predefined way, so using it to build a risk model is more challenging than using structured data.

Once you have identified the pain point, you may work out with your partner/vendor the tradeoffs considering your population and channel. Note the following tips:

• Highly digital populations already served through an online channel may be approached using digital data, but you must make sure that you can get the volumes required to build a model based on unstructured data (unstructured data requires more volume to build a model).

• People with whom you already have an ongoing relationship may be a good population to leverage mobile phone data, as they may perceive a benefit to downloading and keeping your mobile application.

• Less digitized populations, served through traditional channels (branches or field loan officers) may be better suited for psychometrics.

Avoid the pitfall of falling in love with a specific data source and then figure out a use case within your business. Go the other way around: “given my business need, what data source better fits it?”

4. Partner with somebody that can handle multiple data sources

“When you only have a hammer, all problems look like nails,” my first boss told me a long time ago. To avoid the pitfall described on recommendation three, you must partner up with a vendor that can manage several data sources.

This will not only let you choose the right pain and business to focus on, but also give you flexibility as you roll out.

For example, we found, while working with a one client that their clients would willingly share their email data. Unfortunately, we found that they used their email so scarcely, that we couldn’t score many of them. Now we are working with psychometrics in this population.

In another situation, we started using psychometrics to approve more people at a Mexican e-lender. In the meantime—while they were approving more clients—we collected digital data from these same applicants. After several months, we have been able to combine both sources of data to approve even more people.

5. Persevere

If you are like most of us and work for an organization that needs results in a few quarters, structure your initiative to collect early results that may give you inertia while you go for the long-term prize.

We work with an institution that provides big loans. They do not have that much volume, but they invest heavily in each prospect. Big stakes, low volume is the most challenging environment to build an alternative data-based score. It took us almost 4 years, but now they are harvesting the fruits of their perseverance.

To deal with this issue, you need to be creative to identify secondary pain points that may be addressed quickly along the way.

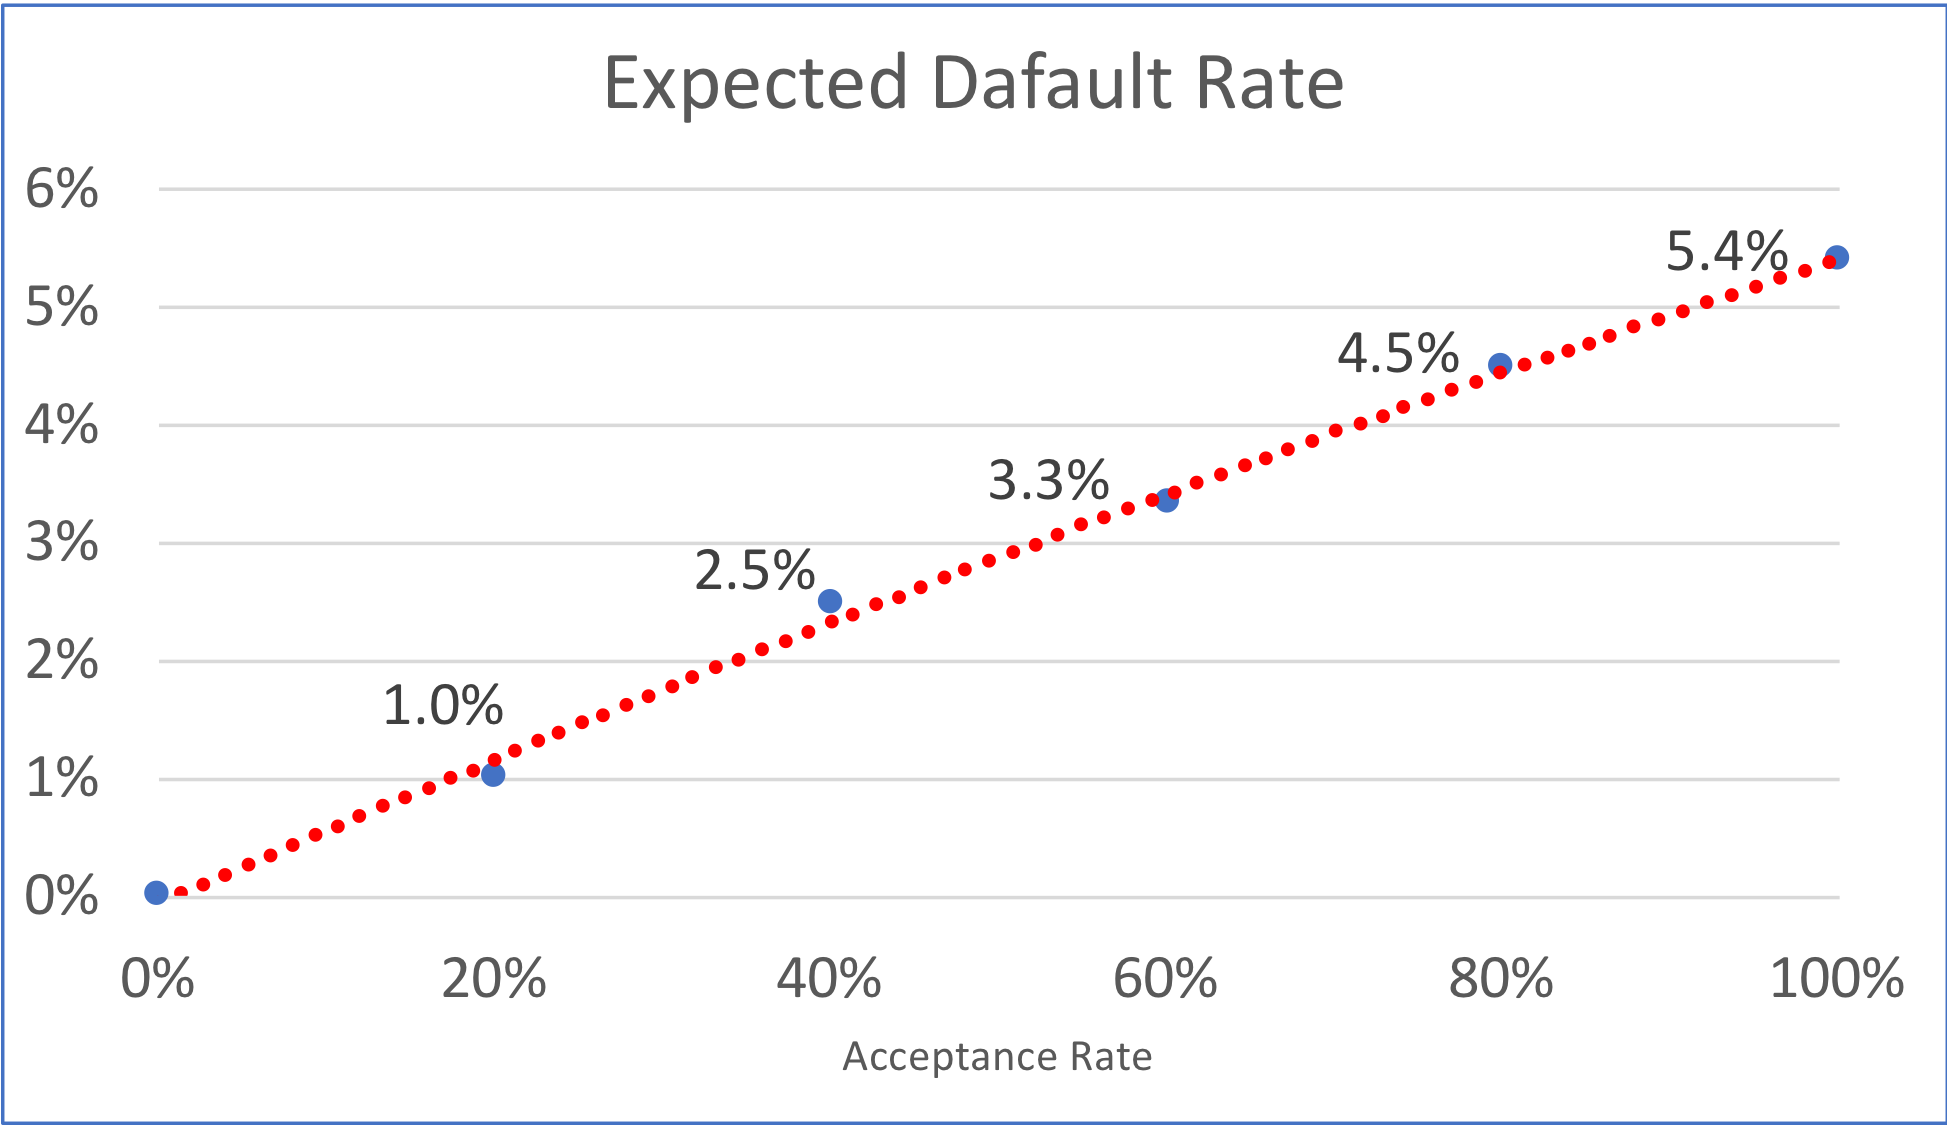
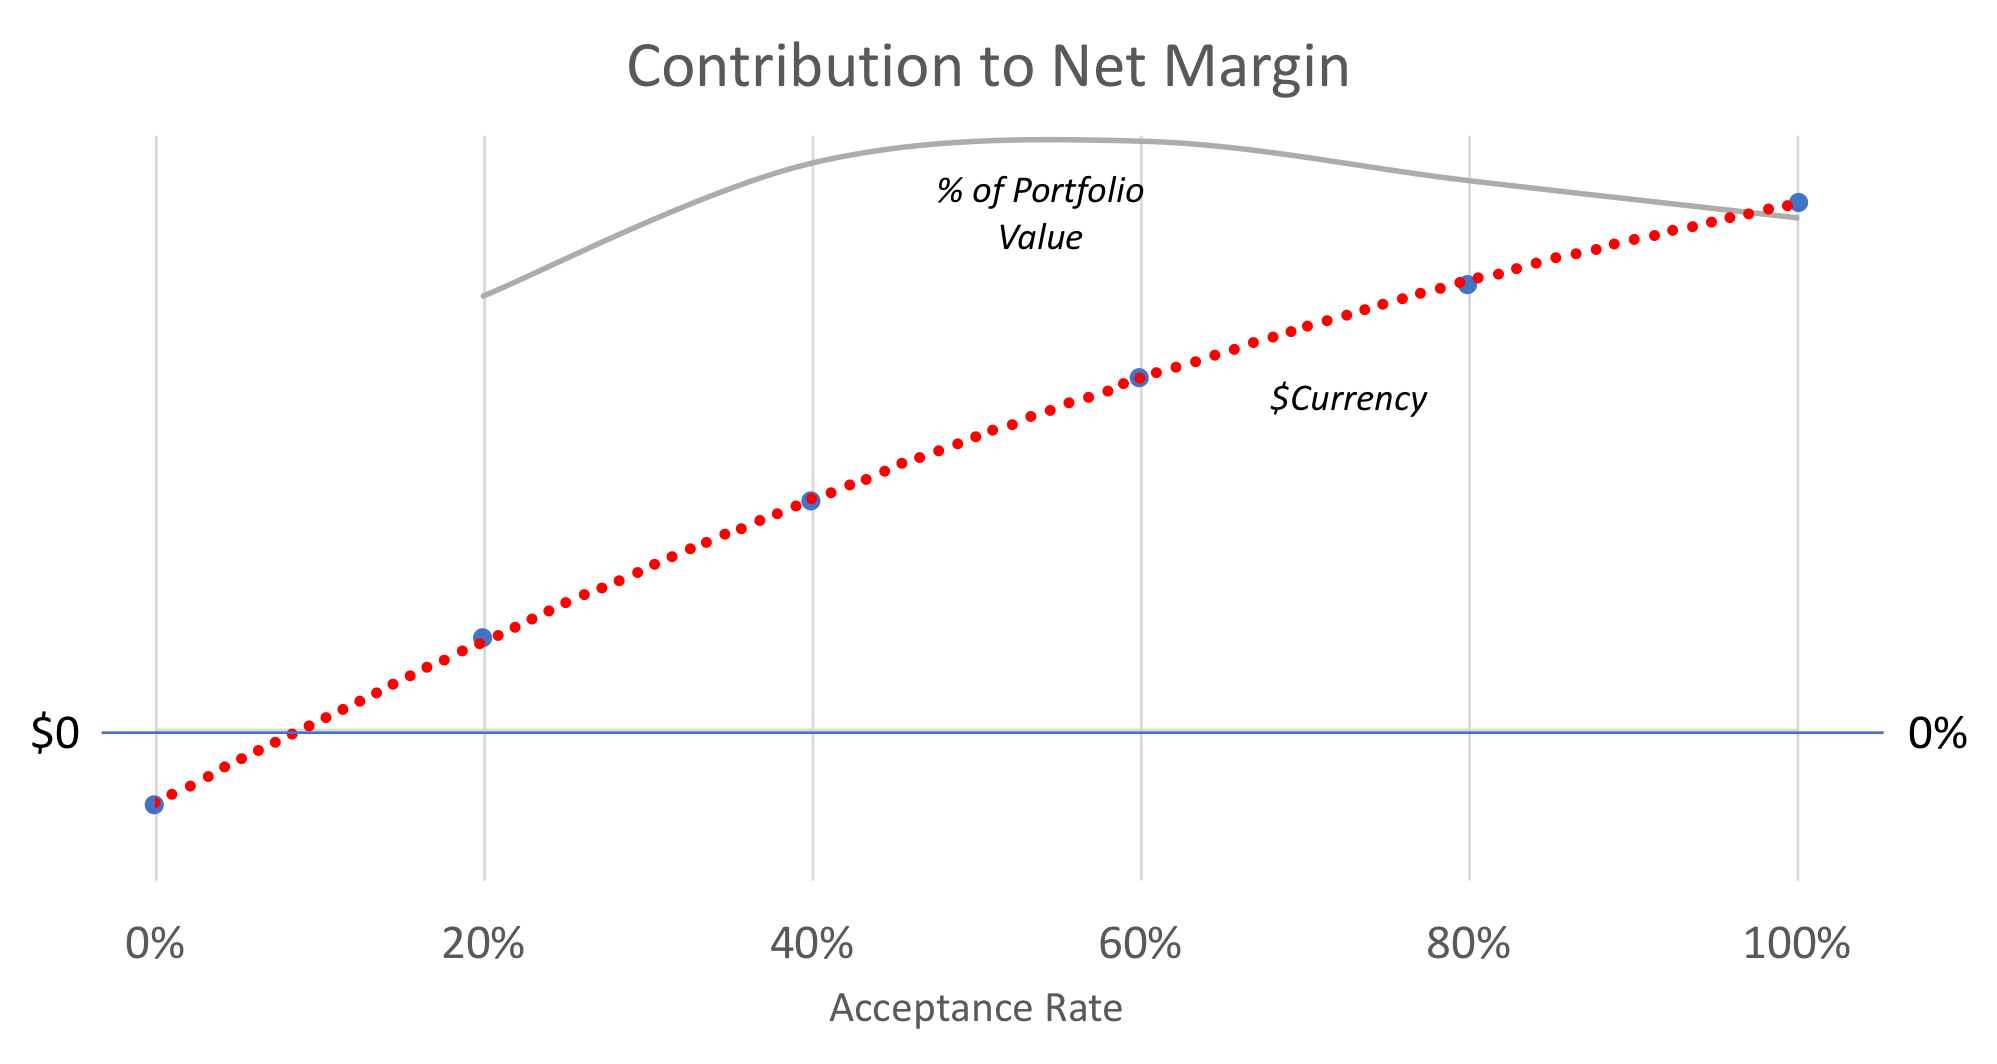
For example, we worked for a retailer that wanted to increase approvals while keeping defaults in line by approving new-to-credit consumers. Loans had mostly 24 to 36-month terms and most 60 days defaulters tended to recover. That was a challenging situation: we would have to wait 12 months for vintages to mature, and look for 90 or 120 days in arrears for the “bads” to profile. It looked like a 2 to 3 year project.

But we found a secondary pain: “straight rollers.” These were loan recipients who didn’t pay their first two or three installments and were eventually written off. We collected data on all their clients to quickly build a “straight rollers model.” We only needed 3 installments on each vintage to identify bads.

Along the way, we are collecting data that will be used to build an admission score to address the main pain.

In summary, building credit policies based on alternative data is challenging. Fortunately, there is enough learning accumulated in our community to avoid some pitfalls and we hope you find these tips useful.

See post in CFI.Org

Blog | Winning Agent Incentivization Strategies

By Brett Elliot, Director of Product, LenddoEFL
An agent helps a microentrepreneur apply for a loan in India

An agent helps a microentrepreneur apply for a loan in India

Lenders often use loan officers, promoters or other types of agents to sell loans, financing, and credit cards. This can be an effective way to acquire new customers but there is a big risk in this approach. Agent incentivisation plans will make or break your bottom line. Good incentive plans lead to large, healthy portfolios, but bad ones lead to fraud, default and chargebacks. We’ve worked with lenders all around the globe and have seen both good and bad strategies. Here are some of the best and worst.

Worst agent incentivisation strategies

Paying per applicant

When your goal is to get new customers, a very simple approach is to pay agents for each customer that applies. Obviously, the more people into the top of the funnel, the more customers you will get right? Not exactly. Agents will optimize for their commissions. First they will go after good borrowers, then they will go after anyone. And some of them will realize they can make up fake applicants so they don’t have to go after anyone at all. If you simply try to optimize the number of applications, you will get a lot of applications, few disbursements, and even fewer good customers. This may seem obvious but we know of a large commercial bank in South America that did this and they had a huge problem finding good borrowers.

Paying per approval

Since paying per applicant does not work, the next logical step is to pay per approval. This way your agents can still acquire as many people as possible but you keep the portfolio healthy with controls in your approval process. This is the most common approach to incentivizing agents but it does create a perverse incentive for the agent to game the system in order to get more approvals. For example, one lender in Mexico was offering credit cards to college students. At some point the agents discovered that the only criteria for approval was that the applicant be under 26 years old. This caused a huge spike in fraud as the agents signed up anyone they could find that met the age criteria. If you are going to pay per approval, the controls you set must be strong and difficult to game. See below for recommendations about how using technology can help.

Paying a commission higher than the loan interest

A subtle but often overlooked problem with any incentive plan is paying an agent a higher commission than the loan interest costs. We know of a digital bank in South America that does this and they are experiencing a type of perpetual fraud. In this scheme, the agent fills out an application using a stolen identity. Then he takes out another loan using a different stolen identity and pays back the first one with it. He repeats this process over and over, collecting his commission. This is only possible if the commission is higher than the interest rate so keep that in mind when making your commission schedule.

Good agent incentivisation strategies

Paying a percentage of the money collected

One approach that aligns the agents and lenders is to pay the agent a percentage of the money collected. This incentivizes the agent to sign credit worthy new customers but also to follow up with the customer and make sure they make their payments. We sometimes call this the “MFI model” because of how effective some MFIs have become by using it.

Withholding payment for a certain period of time

Paying a percentage of the money collected doesn’t work for credit cards, but a strategy that does is to withhold payment for a certain amount of time. For example, one financial institution we know of pays the agent a little when the credit card is activated and then the remainder in 4 months so long as the card is not in arrears.

Recommendations

Combine several incentives

There is no one size fits all for any company and often combining different incentives works really well. The companies with the healthiest portfolios that we have seen do this. For example, a large MFI in Mexico pays their agents a very low fixed salary, plus a percentage of the amount disbursed and a percentage of the money collected.

Use technology to strengthen the controls

If you are certain that your controls and risk models are effective at weeding out the bad borrowers, then paying per approval is a reasonable approach. But how certain are you especially if your customers do not have much credit history? Technology can definitely help in this area. Using highly predictive alternative credit scores is a great start. Be sure to ask the vendor what controls are in place to detect agent fraud since they will try to game the system. At LenddoEFL, our scores are backed by our Score Confidence system which looks out for suspicious loan officer behavior and coaching as well as other signs of fraud.

Final thoughts

The end goal is to reward agents for portfolio growth and portfolio quality.  Lenders that limit the number of new clients added per month, maintain a solid portfolio of recurring clients, and combine different incentives for compensating agents, seem to have the largest and healthiest portfolios.

Blog | Turning Gini into Profits

Written by Rodrigo Sanabria, Director Partner Success, Latin America

On a prior post by Carlos del Carpio (“The Economics of Credit Scoring”), we discussed the business considerations to assess the merit of a risk model. In this post, I will address how a good origination model impacts the bottom line of a company’s P&L.

These principles may be adapted to look into other types of models used at later stages of a loan life, but on this post we will only address loan origination.

From a business point of view, an origination model is a tool that helps us aim at the “sweet spot”: where we maximize profits. A simple way to think about it is as a trade-off between the cost of acquisition (per loan disbursed) and cost of defaults (provisions, write-offs): The higher the approval rate, the lower the cost of acquisition, but the number of defaults go up.

How do we go about finding the sweet spot? I’ll try to explain it below.

Figure 1

Figure 1

A good model has a good Gini. A “USEFUL” model creates a steep probability of default (also known as PD) curve – we usually refer to it as a “risk split”.


Figure 1 shows the performance of a model based on psychometric information used by an MFI. The Gini (not shown in the graphic) is pretty good (0.28). The risk split is great: the people in the lower 20% of the score ranking are about 9 times more likely to default than those in the top 20%.


Knowing the probability of default for a given group, we may set a credit policy. Basically, we need to answer: “what would the default look like given an acceptance rate?”


Figure 2

Figure 2


We have re-plotted the same data in Figure 2, but now we express the probability of default in accumulated terms. Basically, the graph shows that if we were to accept 80% of this population sample, we would have a 4.5% PD, but if we were to accept 40%, the PD would go down 2 points to 2.5%.

Now, from a business point of view, we still do not have enough information to decide. Do we?


Where would the profit be maximized?

The total cost of customer acquisition is mainly fixed. Whatever we spend on marketing and sales to attract this population, will not change if we reject more or fewer applicants. So, the cost per loan disbursed would grow as we reduce the acceptance rate.

Of course, the higher the acceptance rate, the larger the portfolio, and the more interest revenue we get. BUT, the higher the provisions and write-offs. The combination of these 2 variables (cost of acquisition and net interest income) produces an inverted U-shaped curve that uncovers the “sweet spot”

Figure 3

Figure 3

The current credit policy is yielding a profit at 100% acceptance rate (see Figure 3) because the sample being analyzed corresponds to all the customers that were accepted (i.e. we have repayment data about them). So, the portfolio is profitable.

But the sweet spot seems to be shy of 60% acceptance rate. If this FI were to cut down its approval rate to that level, profits would increase by about a third, and its return on portfolio value would almost double. Of course, there are other considerations around market share and capital adequacy that may play a role in such a strategic decision, but the opportunity is clearly uncovered by the model.


In my experience, the sweet spot usually lies within 30%-70% acceptance rates, driven by marketing expenditures, interest rates, cost of capital, sales channels, and regulation.

What if the shape of the curve shows a continuous positive growth? The sweet spot is at a 100% acceptance rate! – have we reached risk karma? – Most likely, the answer is no (but almost!).

Figure 4

Figure 4

Most likely, we are leaving money on the table. Some business rule may be filtering people before they are scored. I have experienced this situation while working with lenders. For example, a traditional bank was filtering out all SMEs that had been operating for less than X years. This bias in the population was creating a great portfolio from a PD point of view, but there was clearly an opportunity to include younger businesses. As you can see in Figure 4, the maximum return on the portfolio was achieved at 60% approval rate, but they could increase profits by approving beyond the current acceptance rate. Depending on their cost of capital, it may be a good idea to expand the portfolio by approving more people.

In summary, think of your origination model as a business tool. Don’t stop at looking at Gini to assess a model’s merit. Understand how your profitability would be impacted by changes in your acceptance rate. If the PD curve is steep enough, you may capture quite a lot of value by applying the model to either reduce or increase your acceptance rate.

CFI.Org | To Bank the Unbanked, Start Using Alternative Data

Capturing digital footprints using psychometrics can help FSPs reach the unbanked.

By Rodrigo Sanabria, Partner Success Director, Latin America, LenddoEFL

Originally posted on the Center for Financial Inclusion's Blog.

In a recent post on her report, Accelerating Financial Inclusion with New Data, Tess Johnson highlighted the huge opportunity that alternative data represents for the future of financial services. The simple fact that mobile and internet penetration have surpassed financial services penetration in most emerging markets hints at a big opportunity: many people who have had no meaningful access to formal financial services are creating digital footprints financial service providers can capture and analyze to reach them with commercially viable services that help them improve their lives. This prospect is also made possible thanks to machine learning and big data methods that were not available to us a few years ago.

Field team testing its psychometric credit assessment in Mexico. Credit: LenddoEFL

Field team testing its psychometric credit assessment in Mexico. Credit: LenddoEFL

For those of us in the world of financial inclusion, these are very exciting times: the simultaneous emergence of online penetration and data analysis methods is generating an opportunity that our predecessors in this field couldn’t even have imagined.

The bad news is that harnessing digital footprint data using machine learning is not easy; it requires time, commitment and skills that are in short supply. However, the good news is that those with the vision and  endurance to leverage this opportunity will build a competitive advantage that will be sustainable for years to come.

When developing an alternative credit score based on traditional information (e.g., demographics, repayment data), analysts usually have historical data to design and train models. Through back testing, the credit scoring model is applied to historical data to see how accurately it would have predicted the actual results (i.e., loan repayment). We can get a pretty good sense of how the model will perform in the future and set up a credit policy accordingly. Yet, when we cannot use such traditional data sources, we are entering into uncharted territory.

Lacking prior information about our current customers’ psychometric profile or digital footprint, we must build those data sets from scratch. Depending on the data source, we may need very large data sets to compensate for the lack of data structure (unstructured data is simply data that is not easily accessible in a format or structure, like an Excel spreadsheet, that is optimal for generating insights). Just as with all other artificial intelligence applications, the more data you collect, the more predictive and stable your algorithms become. LenddoEFL is an example of an organization that gathers data for these profiles and footprints. It is an alternative credit scoring and verification provider that uses psychometric and other data about a loan applicant to determine a credit score and verify identity.

Furthermore, even state-of-the-art alternative data sources do not necessarily allow you to build models that are stable and reliable across multiple segments of the market. Therefore, you need to build algorithms that are specific to your target population.

One of the most challenging issues when implementing alternative data scoring initiatives is showing the results that can be achieved within a given set of time and budgetary constraints. In the long run, after the portfolio has matured, you can show whether using alternative data allowed you to approve more applicants within your target default levels, controlling by business cycle. But if you are working with 24- to 36-month loans, it may take three or four years before you can fully assess the impact of using alternative data, by which time internal attention spans may have already run short.

To account for that, LenddoEFL uses early indicators of model performance. We set a target maturity and days in arrears according to a financial institution’s portfolio’s profile, for example, 60 days in arrears within the first 9 months. Then we calculate a Gini coefficient—a scale of predictive power that can help lenders understand how good its credit score is at assessing who will repay and who will default on a loan (not to be confused with the Gini coefficient that measures income inequality) for the model as applied to that portfolio. (For more details on how to use the Gini, check out our blog series from our risk and analytics team: Part 1Part 2Part 3).

Is it too late to pursue an alternative credit scoring initiative? I would say yes, there are plenty of companies already doing this—Te Creemos in MexicoMynt in the Philippines and Business Partners in South Africa—but only a few lenders are utilizing alternative data in each market. You could be the first institution in your segment and country to implement such an initiative, and you can still take advantage of others’ experiences and learning.

The sooner you start collecting data and building models, the sooner you will be able to underwrite the unbanked segment better than your competition, and the longer the window of advantage will be. For those who start late, catching up with the early adopters will be a great challenge.

Read article on cfi-blog.org

Lodex | The Disruptive Potential of Blockchain on Financial Inclusion

Originally posted on Lodex website.

MIC_RE_cryptocoin-pages_Main-page_v3.jpg

Technology and data advancement is rapidly providing us with tools for greater and data-driven insights. We are looking at new ways to solve old, longstanding problems.

LenddoEFL is a fantastic example. Through data and tech, LenddoEFL provide financial service providers, all around the world, an alternative tool to help measure a consumer's creditworthiness. 

We know that blockchain technology walks hand in hand with disruption and innovation, therefore, we wanted to hear what the pioneers at LenddoEFL's thought on this hot-topic.

We had a chat with Jeff Stewart, LenddoEFL's Co-Founder & Chairman, who shared some of his insights into the use of blockchain for companies and how it can impact consumers. Check it out!

"The new innovations are opening up the possibility of consumers having more control over who sees what information when and being able to track who has seen it."


1. How do you see Blockchain Technology supporting LenddoEFL’s business?

At LenddoEFL, we are convinced that blockchain is one of the most innovative technologies since the public internet. We are also convinced it opens up opportunities for further providing access to financial services, cheaper and more conveniently. Since we started LenddoEFL in 2011, we have been continually innovating, anticipating the future and exploring new and upcoming technology solutions, and blockchain is one of these. 

We have already successfully deployed our solution in the Ethereum blockchain ecosystem, where we are able to seamlessly provide our services and automate decisioning in smart contracts. As distributed ledger technology is further developed to reduce friction across the customer lifecycle, we believe we can further help lenders make better decisions and extend financial services to the unbanked. Blockchains, smart contracts and new cryptographic distributed architectures will allow us to do this faster and with less friction.

2. Will Blockchain be helpful or a hindrance for consumers owning their own data? How do you see the help or hindrance affecting the consumer?

It is too early to say for sure, but the technology is evolving very quickly. The new innovations are opening up the possibility of consumers having more control over who sees what information when and being able to track who has seen it.

One critical part to remember is that although the Zero Knowledge Proof offers exciting opportunities, consumers face similar challenges that exist today with regard to understanding what data is being put on the blockchain. If a third party uses the blockchain thoughtfully, they will not include any personally identifiable information (PII), but rather just identifiers. This means that the consumer still has the right to be forgotten, and maintains the ability to control and delete their data.

On the other hand, if a third party puts your data or your PII directly on the blockchain, it is permanent and unalterable and potentially accessible to anyone. This is absolutely unacceptable in our view, and problematic for consumers.

With the rise of GDPR protecting European consumers’ data, the Facebook scandal, and at the same time PSD2 putting the consumer in charge of their financial data and allowing it to be shared, it will be interesting to see how the blockchain can facilitate better control and ability to share when so desired. 


Jeff-Stewart-Headshot.jpg

Jeff Stewart, LenddoEFL's Co-Founder & Chairman

3. Are there any projects that you are working on in the blockchain space that you can share?

We have been researching the blockchain for over 3 years and our team is actively working on a number of exciting projects. It’s too early to share the details but we are keenly interested to be part of the development in the blockchain space and will have more to share in the coming months.

4. How do you see BLOCKLOAN supporting your business in the future?

BLOCKLOAN is a new Banking-as-a-Platform using blockchain technology with a lot of potential for empowering customers with increased financial flexibility. We are excited to help grow the platform through new functions and features linked to identity verification and credit scoring.

Read article in Lodex blog.

Blog | On the use (and misuse) of Gini Coefficients in Credit Scoring: the Economics of Credit Scoring

This is the fourth part of a series of blog posts about Ginis in Credit Scoring. See also part 1, part 2, part 3.
image4.png

Gini Coefficients and the Economics of Credit Scoring

On a global scale, billions of dollars in debt are granted every year using decisions derived from credit scoring systems. Financial institutions critically depend on these quantitative decision to enable accurate risk assessments for their lending business. In this sense, as with any tool that serves a business purpose, the application of credit scoring is not ultimately measured by its statistical properties, but by its impact in business results: how much can Credit Scoring help to increase the benefit and/or to decrease the cost of the lending business.

Assessing Credit Scoring from a business perspective could sound pretty obvious. However, given the typical compartmentalization of roles that could exist at lending institutions, where Risk and Modeling teams can be completely separated from Commercial departments, it could be easy sometimes to focus too much on the statistical aspects of credit scoring such as Ginis, and forget the ultimate business nature of its purpose. Although there is a clear positive relationship between economic benefits and predictive power, there are also certain elements that can affect the balance between costs and benefits. In this post, we discuss some of these elements and explain their role in the cost-benefit analysis of credit scoring.


The benefits of credit scoring

The benefit of credit scoring derives from its ability to accurately identify good customers, and discriminate them from bad customers. The more good customers a model can identify, the greater the interest income that can be generated from a credit portfolio. And the more bad customers it can discriminate, the lower the losses for the credit portfolio. In this sense, the economic benefit of credit scoring can be amplified by two things: the volume of customers, and the size of the credit disbursed to these customers.

Take for example the portfolio of microfinance institution “A” with several thousands of customers but very small loan amounts, and compare it against a smaller microfinance institution “B” providing loans of the same size to a portfolio of just a few hundred customers. Both institutions can see a similar increase of 1% in the predictive power of their credit scoring models, however, the increase in economic benefit yielded from this increase in predictive power will be different just because of the different sizes of portfolio volumes. Everything else being equal, the higher the volume of the portfolio, the higher the potential economic benefit of credit scoring.

The same can be argued for the size of credit disbursed to the customers of a portfolio. For example, take an SME lending institution with just a few thousands of customers but with relatively high credit amounts in the hundreds of thousands of dollars. An increase of 1% in predictive power could bring just a handful of new good clients into the portfolio, or avoid the disbursement of a handful of very bad loans. However a change in just a handful of good or bad clients can be enough to generate a considerable increase of economic benefit in the portfolio given the large size of the loans.


The costs of credit scoring

The costs of Credit Scoring can be split in two parts. First, the cost of developing a new model, and secondly, the cost of implementing and maintaining credit scoring models.

If we assume lending institutions are at a stage of technological maturity in which all the necessary data to create a credit scoring model exists and is continuously updated with certain level of quality and integrity, then the first type of cost just depends on the complexity of the modeling process. The whole process of building a model includes data extraction and cleaning, feature engineering, feature selection and the selection of a classification algorithm.

Depending on the lending institution, this process can be handled by a single data scientist (e.g. think of the CRO of a small Fintech startup), or it can be handled by a large department including many different teams with different roles such as data engineers, data scientists and software engineers (e.g. think of a large multinational bank). At the same time, the teams in charge of the model building process can be comprised of junior analysts fresh out of college using well-known standard techniques or include teams of PhDs in computer science doing advanced machine learning. At the end, the cost involved in developing the credit scoring models will depend on how much complexity and sophistication can be afforded and/or needs to be put into the process.

Once the model has been built, it also needs to be implemented and monitored over time. The costs involved are not trivial. Again, they will depend on the stage of technological maturity of the financial institution and the complexity and sophistication required. For example, in some cases the implementation of a credit scoring model can be as simple as creating an Excel calculator loaded with the coefficients of a logistic regressions where some values are manually inputted by a Loan Officer to get a score (e.g. think of a small MFI in the rural area of a developing country). Or it can be as complex as a Python package in a cloud-hosted decision engine integrated in the online platform of a large bank. The handling of big data, software development and testing, as well as the security and legal aspects involved in the deployment of a credit scoring system can considerably increase its costs. And all this, without even considering if the teams that will monitor the performance of the models implemented on a defined frequency basis are dedicated full time, or they are just the same team that also did the modeling and/or deployment.


Bottom-line:  The statistical classification accuracy measured by Gini coefficients are indicative of some part of the benefits of using credit scores, but they are not the most important nor the final metric when assessing the cost-benefit of credit scoring. The reason is because the benefits of credit scoring can be influenced by the volumes of customers and the size of the credit. And the costs of credit scoring ultimately depends on the stage of technological maturity of the lending institution, as well as how much complexity and sophistication can be afforded and need to be put in the development, deployment and monitoring of credit scoring models.   

So next time you need to make a decision about using Credit Scores to boost your lending business, ask how much they can help to increase the benefits of the business, and how much they can help to decrease its cost. The final decision will depend on a lot more than just Ginis.


At LenddoEFL, we have the expertise to help you boost the benefits and reduce the costs of credit scoring using traditional and alternative data. Contact us for more information here: https://include1billion.com/contact/.


How banks can benefit from collaborating with FinTechs

By Satoko Omata | 10 July, 2018

072318.jpg

TODAY, customers expect more from their banks – who are slow to deliver new products, services, and experiences as a result of their legacy systems and archaic processes.

However, those that truly want to meet and exceed expectations (and snatch up a bigger share of the market), there are a few lessons they can learn from fintechs.

By partnering with fintechs, banks would have access to new services that help deliver better offerings to customers, at cheaper rates.

At the Wild Digital conference on Wednesday, panelists at a discussion observed that of all the industries, those dealing with money-based investments have been the least changed by technology.

The panel featured Richard Eldridge, Co-founder and CEO of Lenddo EFL; Ashley Koh, Senior Vice President and General Manager of Send, Matchmove; Michele Ferrario, Co-Founder and CEO of StashAway; and Gan Pooi Chan (PC), Country Director GoBear. 

Read full article on Tech Wire Asia.

Caja Sullana provee a jóvenes emprendedores acceso a crédito en alianza con LenddoEFL, en el marco de proyecto con Fundación CITI y COPEME

20180516_182214.jpg
Citi Logo.png

Lima, Peru, 16 de julio del 2018 – Organizaciones se han unido para financiar una alternativa innovadora de evaluación crediticia para incrementar el acceso a financiamiento a jóvenes que no cuentan con posibilidades de acceder a financiamiento que recién están comenzando un negocio.

Cuatro instituciones se han unido para invertir y avanzar en la innovación liderada por jóvenes en el Perú. Los jóvenes emprendedores que tienen dificultades para acceder a crédito debido a la falta de historial crediticio, ahora pueden solicitar un préstamo de negocios de la institución financiera peruana Caja Sullana usando la evaluación de crédito psicométrica de LenddoEFL, una fintech que potencia las decisiones basadas en datos alternativos para promover la inclusión financiera.

Fundación CITI financia esta iniciativa como parte de sus esfuerzos para impulsar las iniciativas empresariales de los jóvenes en los mercados emergentes. COPEME, una organización peruana que promueve la inclusión financiera, gestiona este proyecto como potencial para expandir esta tecnología a otras instituciones financieras del país.

Caja Sullana, que actualmente usa la evaluación psicométrica de LenddoEFL tanto en agencias como online, buscaba una forma de aprobar más personas con poca información crediticia de manera más sencilla. El proceso previo de evaluación crediticia implica visitas y análisis por los oficiales de crédito que consumen tiempo, que muchas veces tienen como resultado el rechazo del préstamo. Con la evaluación de LenddoEFL, Caja Sullana puede agilizar su proceso de solicitud de crédito, reducir la carga de trabajo para los oficiales de crédito, y tomar decisiones más informadas sobre los solicitantes con poca información.

“Citi Perú está comprometido con el empoderamiento económico de las comunidades donde vivimos y trabajamos, por eso promovemos este programa que fortalece a las microempresas y promueve las micro finanzas. Este proyecto constituye una excelente iniciativa para estimular el uso de tecnologías y para promover la inclusión financiera en las comunidades más alejadas”, señaló Camila Sardi, Head de Asuntos Públicos de Citibank del Perú.

"Dos de nuestros ejes estratégicos son el apoyo a la inclusión financiera de más peruanas y peruanos, en particular de zonas rurales y peri-urbanas, y la implementación de soluciones innovadoras que mejoren la eficiencia de las instituciones de micro finanzas: En ese sentido, el proyecto ejecutado con el apoyo de Fundación Citi, se suma a las acciones que en el marco de estos dos ejes desarrollamos en el país, habiendo encontrado en Caja Sullana y LenddoEFL, dos organizaciones cuyo alcance, experiencia y objetivos facilitan la consecución del propósito de su diseño y puesta en marcha: la incorporación al sistema financiero de jóvenes emprendedores a través del empleo de una herramienta disruptiva que estamos seguros tendrá un impacto significativo." afirma Carlos Ríos Henckell, Gerente General de COPEME.

“Tenemos como objetivo atender a los segmentos más jóvenes y ofrecerles esta nueva opción para ingresar al sistema financiero, considerando su perfil como emprendedores en potencia. La falta de historial crediticio dificulta el acceso a herramientas de desarrollo, por lo que nos esforzamos en promover la inclusión financiera y ser el soporte económico que ellos  necesitan”, expresó el presidente del Directorio de Caja Sullana, Joel Siancas Ramírez.

Además, agregó “nuestro sentir como institución siempre ha sido acompañar a los ‘peruanos guerreros’ en el crecimiento de sus proyectos y ser parte importante en la historia de su éxito”.

“Trabajamos con algunas de las mayores instituciones financieras de Perú y América Latina, esta es una oportunidad única de servir a la inclusión de jóvenes emprendedores. La evaluación de LenddoEFL ofrece una forma poderosa de incluir a más personas en el sistema financiero, y estamos entusiasmados de asociarnos con COPEME, Fundación Citi y Caja Sullana para servir mejor a los jóvenes emprendedores de todo el país”, señaló Rodrigo Sanabria, Director Partner Success, América Latina, LenddoEFL.

Acerca de Citi
Citi, el banco líder global, tiene aproximadamente 200 millones de cuentas de clientes y realiza negocios en más de 160 países y jurisdicciones. En el Perú, Citi ofrece a corporaciones, gobiernos e instituciones una amplia gama de productos y servicios financieros, incluyendo servicios bancarios y de crédito, servicios bancarios corporativos y de inversión, corretaje de valores, servicios de transacción y administración patrimonial. Por información adicional, visite: www.citigroup.com 

Acerca de COPEME
Somos una organización que desarrolla actividades y provee servicios para el fortalecimiento del sector microfinanzas, el desarrollo de la Mype, y el fomento de la inclusión financiera. Trabaja en Perú desde 1991, alcanzando sus acciones a microfinancieras de todo el país, empresas privadas, organismos públicos, proveedores de fondos, inversionistas y otros actores relacionados al segmento Mype y de microfinanzas. http://www.copeme.org.pe/

Acerca de Caja Sullana
Somos la Caja Municipal de los emprendedores con norte, tenemos ya más de 30 años en el Sistema Financiero regulados por la Superintendencia Nacional de Banca y Seguros. Actuamos bajo la forma de Sociedad Anónima, con el objetivo de captar recursos y utilizarlos para brindar diferentes servicios financieros, preferentemente a las pequeñas y micro empresas, contribuyendo así al desarrollo económico en las diferentes regiones donde operamos, siempre comprometidos en ofrecer estos servicios con alto sentido de Responsabilidad y Calidad. Más información sobre nosotros o nuestros servicios: http://www.cajasullana.pe.

Acerca de LenddoEFL
Nuestra misión es proveer a mil millones de personas acceso a poderosos productos financieros a un menor costo, más rápido y conveniente. Usamos Inteligencia Artificial y Análisis Avanzado para traer las mejores fuentes de digital y psicometría para ayudar a las instituciones financieras en países en desarrollo para atender en confianza a las personas que no están bancarizadas y pequeños negocios. A la fecha, LenddoEFL ha proporcionado productos como puntajes crediticios, verificación e Insights a más de 50 instituciones financieras, ayudando a siete millones de personas e impulsando el préstamo de dos mil millones de USD. Para mayor información, visite https://include1billion.com/.

Blog | On the use (and misuse) of Gini Coefficients in Credit Scoring: Gini and Acceptance Rate

photo-1506704810770-7e9bbab1094b.jpeg

This is part 3 in a series of blog posts about Ginis in Credit Scoring. Read part 1 and part 2.

The relationship between Gini Coefficients and Acceptance Rate

One of the most frequent uses of Credit Scores is to decide whether to admit or reject an applicant applying for loan. This is usually called an “Admission score” or “Origination score”. A key decision around this use case is the selection of a score cut-off that will determine a threshold for admission. This cut-off value determines the acceptance rate of the population.

If the score is working well and predictive power is good, the relationship between acceptance rate and default rate will be positive. The higher the acceptance rate, the higher the default rate of the accepted population and vice versa. The direction of this relationship also has two implications: when acceptance rate is higher, the absolute number of bad loans (i.e. non-performing loans) or “bads” will also be higher, and the proportion of these “bads” in respect to the total loans in the accepted population will be higher too.


What does this mean in practical terms?

It means that the predictive power as measured by a Gini coefficient for the exact same score at different levels of acceptance rate for the exact same population will be different. The higher the acceptance rate, the higher the Gini coefficient and vice versa.

This is something that can be easily tested. If you have a portfolio and a score with good predictive power, you can calculate the Gini coefficient for different score cutoffs or acceptance thresholds and the results should look something similar to this example of a typical credit portfolio:

image6.png

So for example, if there is a change in credit policy and the acceptance rate is lowered from 60% to 40%, the Gini coefficient for the same score over the new sample may also be lower. Does that mean the model is not working anymore? Absolutely not. All the contrary, it’s probably just a good signal that the score is doing a good job. Once a change in acceptance rate is implemented, results should be assessed by the change in default rate, not in predictive power.

Bottom-line:  To judge the predictive power of a Credit Score by the means of Gini, you also need to take into account the Acceptance Rate at which the Gini coefficient is measured. Lower Acceptance Rates will tend to have lower Gini coefficients by construction, even if it is the same exact score over the same population.

The fundamental reason behind this phenomenon was discussed in the part 2, where we explained why Gini coefficients should only be directly compared over the exact same data samples, even if the two samples correspond to the same population.


By: Carlos Del Carpio, Director of Risk and Analytics, LenddoEFL

By: Carlos Del Carpio, Director of Risk and Analytics, LenddoEFL

Blog | Lessons from the field: How we created new group psychometrics to increase financial inclusion in Mexico

While Jonathan takes notes, Gerardo helps an applicant navigate our psychometric assessment on a mobile device. An essential component of our field work was to get direct usability feedback from applicants as they completed new psychometric content.

While Jonathan takes notes, Gerardo helps an applicant navigate our psychometric assessment on a mobile device. An essential component of our field work was to get direct usability feedback from applicants as they completed new psychometric content.

By Jonathan Winkle, Behavioral Sciences R&D Manager, LenddoEFL

An experimental psychologist by training, I am relatively new to the world of financial technology. Since joining LenddoEFL, I have embraced terms like information asymmetry, alternative data credit scoring, and financial inclusion. Yet it was only during a recent trip to the field that I was able to meet the people behind the FinTech jargon we use in our day-to-day, the small business owners whose lives we help improve in our mission to #include1billion.

In April of this year, I traveled with colleagues to Veracruz, Mexico to test new psychometric content for one of the top 3 microfinance institutions (MFI) in the country. Their group loan product extends a line of credit to a collection of business owners, but liability for payments is joint: if one person misses a payment, the group must still make that payment in full. Since many of those applying for these loans lack traditional credit histories, this MFI asked LenddoEFL to develop psychometric exercises that could quickly and reliably assess group traits that predict creditworthiness.  

There are traits that define a strong social group which are nonexistent for individual borrowers. A successful group has strong internal relationships that ensure they will help each other in times of need. A tenacious group can generate creative ideas to solve problems that arise when life presents hardships, as it is wont to do. And a cohesive group exhibits decision making abilities that allow it to act deliberately and with confidence. We designed new psychometric exercises to measure these core traits, and tested them in the field with groups of small business owners applying for loans.

Hiding from the Veracruz heat underneath a family’s palapa, Gerardo leads a collection of applicants through our group psychometric exercises while Jonathan makes observations about their behavior.

Hiding from the Veracruz heat underneath a family’s palapa, Gerardo leads a collection of applicants through our group psychometric exercises while Jonathan makes observations about their behavior.

Measuring interpersonal relationships through social pressure
To measure the strength of a group’s interpersonal relationships, we examined the social pressure that exists among group members. Do individuals feel that they can answer sensitive questions honestly? Or do they feel pressure to conform to the opinions of the group majority? While the group was sitting together in one room, we asked them to raise their hands if they agreed with statements about the trustworthiness, fairness, and helpfulness of their local communities. We then asked individuals to answer these questions privately. The discrepancy between how the questions were answered in each setting could reveal how much social pressure exists, and thus how comfortable group members are being honest with each other. We expect that less social conformity means the group’s interpersonal relationships are stronger, an important factor for predicting whether the group will cover individuals who may miss payments throughout the loan cycle.

Measuring creativity through brainstorming
To measure a group’s creativity, we created a set of generative exercises. For both an easy and a hard problem, we had groups brainstorm as many solutions as they could in 60 seconds. The number of solutions generated was recorded as a creativity metric, and, as predicted, groups generated many fewer ideas for the harder exercise. We were also interested in the group’s dynamic as they performed these tasks. Were they apathetic or engaged? Was there a dominant member of the group? Ultimately, when a loan payment is due and some individuals are short on money, can the group come up with ideas for how to get the extra money? We hope that these generative exercises will shed light on this critical group trait.

Gerardo snags a picture with one of the applicants we met and her business, a stand selling eggs, candy, and other sundries. The small scale of some businesses we encountered, such as the one pictured above, reinforces their need for access to finan…

Gerardo snags a picture with one of the applicants we met and her business, a stand selling eggs, candy, and other sundries. The small scale of some businesses we encountered, such as the one pictured above, reinforces their need for access to financial products. This woman’s entrepreneurial endeavors are only limited by the capital she can acquire.

Measuring decision making abilities through consensus
To measure a group’s decision making abilities, we created a time-to-consensus task. This exercise asks the group to solve a problem where all members must agree on the answer they provide. While we asked the groups to estimate the population of the state they live in, we actually don’t care how accurate their answer is! What’s more important in this exercise is how the group reaches consensus. Are they indifferent and accept the first estimate suggested? Or do they take their time and argue intensely while deliberating over possible solutions? What kind of strategies did they use to reach their estimate? Importantly, this task provides loan officers with a window into the group dynamic that might not otherwise be seen if the assessment merely collected static information such as sociodemographics and business revenues.

Financial inclusion is the mission of LenddoEFL, but working directly with the people we want to include allowed me to better understand how our assessments must be tailored to their cultures and experiences. The better we can measure group dynamics that predict creditworthiness, the more successfully we can extend financial services to those in need. As we continue to expand our credit scoring offerings across the world, looking past the business jargon we use and maintaining empathy for the humans we touch is essential on our path to #include1billion.


Blog | On the use (and misuse) of Gini Coefficients in Credit Scoring: Comparing Ginis

By: Carlos Del Carpio, Director of Risk and Analytics, LenddoEFL

This is part 2 of a series of blog posts about Ginis in Credit Scoring. To see the part 1, follow this link.

image5.jpg

What is an AUC?

AUC stands for “Area Under the (ROC) Curve”. From a statistical perspective, it measures the probability that a good client chosen randomly has a score higher than a bad client chosen randomly. In that sense, AUC is a statistical measure widely used in many industries and fields across academia to compare the predictive power of two or more different statistical classification models over the exact same data sample [1].

How is AUC used in Credit Scoring?

In the particular case of Credit Scoring, AUCs are useful for example in the model development process, when there are several candidate models built over the same training data and they need to be compared. Another typical use is at the time of introducing a new credit score, to compare a challenger against an incumbent score over the same sample of data under a champion challenger framework.

How does AUC relate to Gini Coefficient?

The Gini Coefficient is a direct conversion from AUC through a simple formula: Gini = (AUC x 2) -1. They measure exactly the same. And it is possible to go directly from one measure to the other, back and forth. The only reason to use Gini over AUC is the improvement in the scale’s interpretability: while the scale of a good predicting model AUC goes from 0.5 to 1, the scale in the case of Gini goes from 0 to 1. However, all the properties and restrictions of AUC still translate into Gini Coefficient, and this includes the need to compare two different AUC values over the exact same data sample to make any conclusion about their relative predictive power.

image3.png


What does this mean in practical terms?

Any direct comparison of the Gini Coefficients (or AUCs) of two different models over two different data samples will be misleading. For example: If a Bank A has a Credit Score with a Gini Coefficient of 30%, and Bank B has a Credit Score with a Gini Coefficient of 28%, it is not possible to make any conclusion about which is better or which is more predictive because they have been calculated over different data samples without accounting for the difference in absolute number of observations and the difference in proportion of good cases against bad cases. The only direct comparison possible is the one made about two scores side by side, over the exact same data sample.

Bottom-line: To affirm that a certain absolute level of AUC or Gini Coefficient is “good” or “bad” is meaningless. Such affirmation is only possible in relative terms, when comparing two or more different scores over the exact same data sample. Unfortunately this is often not well understood, which leads to the most frequent misuse of AUC and Gini Coefficients, such as direct, un-weighted comparisons of Gini values across different samples, different time periods, different products, different segments and even different financial institutions.


[1] Hanley JA, McNeil BJ. The meaning and use of the area under a Receiver Operating Characteristic (ROC) curve. Radiology, 1982, 143, 29-36.

Blog | On the use (and misuse) of Gini Coefficients in Credit Scoring

image1.png

Over years of blogging, one of our most popular ever blog posts was about the Gini coefficient. In this series of posts, we revisit the Gini and dig further into its uses and the ways we see it misused in credit scoring.

What is a GINI?

For lenders around the world, the “Gini Coefficient” is an often heard, sometimes feared, and frequently misunderstood statistical measure. Commonly used to assess things like wealth inequality, Gini Coefficients are also used to evaluate the predictive power of credit scoring models. In other words, a Gini Coefficient can help measure how good a credit score is at predicting who will repay and who will default on a loan: the better a credit score, the better it should be at giving lower scores to riskier applicants, and higher scores to safer applicants.

Though calculating a Gini Coefficient is complex, understanding it is fairly simple:

A Gini Coefficient is merely a scale of predictive power from 0 to 1, and a higher Gini means more predictive power.

However, there are a few key aspects of Gini Coefficients that are not always well understood and can lead to their misuse and wrong interpretation. Over this series of blog posts we’ll discuss four of them:

  1. People often compare Ginis when they should not. The only useful comparison across Ginis (or AUCs) is when looking at different scores over the exact same data. 

  2. People forget that Gini will vary by acceptance rate. When presented with a Gini coefficient, always keep an eye on the effect of the acceptance rate.

  3. People focus on Ginis, but are not always aware of its impact on the costs, benefits and overall economics of Credit Scoring.

  4. People do not fully understand and often overestimate the role of Gini in the business of lending.


About the Author:

Carlos del Carpio is Director of Risk & Analytics at LenddoEFL. He has 10+ years of experience developing credit scoring models and implementing end-to-end credit risk solutions for Banks, Retailers, and Microfinance Institutions across 27+ countries in Latin America, Asia and Africa.

About LenddoEFL

LenddoEFL’s mission is to provide one billion people access to powerful financial products at a lower cost, faster and more conveniently. We use AI and advanced analytics to bring together the best sources of digital and behavioural data to help lenders in emerging markets make data-driven decisions and confidently serve underbanked people and small businesses. To date, LenddoEFL has provided credit scoring, verification and insights products to over 50 financial institutions, serving seven million people and lending two billion USD. For inquiries about our products or services please contact us here.

Blog | Digital Identities: Learnings from GSMA’s User Research in Sri Lanka

Smallholder farmers in Sri Lanka interviewed as part of the digital identity research

Smallholder farmers in Sri Lanka interviewed as part of the digital identity research

Recently, our friends at GSMA’s Digital Identity Programme and Copasetic Research set off to research digital identities and how they could support smallholder farmers in Sri Lanka. Their key hypothesis was:

“If MNOs, financial institutions, government and other service providers had access to a smallholder farmer’s ‘economic identity’ (income, transactional histories, credit worthiness, rights to/ownership of land, geolocation, farm size, and other vital credentials), they could provide access to more and better tailored services that enhance their productivity.”

In speaking with 40 smallholder farmers in Sri Lanka, as well as 7 stakeholders and 5 agri experts, GSMA learned a lot about the need for digital identities. GSMA invited LenddoEFL’s input in advance of the field research so we were keen to review the learnings. Below are some of the key findings of the report and how it relates to our work at LenddoEFL.  If this is interesting, we recommend reviewing the full report.

Source: Digital Identity for Smallholder Farmers: Insights from Sri Lanka

Source: Digital Identity for Smallholder Farmers: Insights from Sri Lanka

Identity is valued, but farmers are unclear how it relates to additional benefits
In Sri Lanka, the government is rolling out a new smart ID card giving increasing access to official identity. But farmers do not immediately understand how new forms of identity can be used to help them get access to more services (e.g. more tailored information services). Once they make the connection, they see the value clearly.

Identity is valued as it relates to accessing credit
Farmers and banks do not connect directly in many cases and farmers tend to have informal manners of connecting to credit through their buyers and agribusinesses. Banks don’t always have the information they need to cater to farmers. And the microcredit model can be more of a burden on the farmers than it’s worth. The research found that smallholder farmers are happy for their trusted service providers to work together and share information to enable access to credit. But since many farmers receive their income informally, the thought of sharing this information too widely (particularly with the government) caused some concerns.

Source: Digital Identity for Smallholder Farmers: Insights from Sri Lanka

Source: Digital Identity for Smallholder Farmers: Insights from Sri Lanka

Digital ID must build on face to face relationships
In Sri Lanka, farmers rely on and trust institutions with whom they have built local, personal, face to face relationships and these will be the best channels to roll out new systems and technology.

Farming is changing
Climate change and globalization mean that the work of a farmer is changing. Traditional farming skills are no longer enough. Farmers need to be constantly re-considering which crops they will grow now and in the future due to changing weather conditions and fluctuations in profitability. Younger farmers in particular are looking outside of their communities to the internet for new information. This new information needs to be combined with better access to financial services, allowing farmers to finance the transition to new crops, and hedge some of the risks in experimenting with new approaches.

ID needs vary across farmer types
The research found that a farmer’s financial stability and the extent to which they are embracing change (i.e. changes to farming practices, or the use of new technologies) have the most significant influence on their digital identity needs and priorities. GSMA mapped farmers across a 2 by 2 with the axes of poorer → wealthier and embracing change → stuck/fearful of change. In each quadrant is a unique farmer with unique needs. See report for more.

All of this means there is opportunity to better serve farmers (and other small business owners).

Farmers need better access to formal financial services:
Digital financial profiles could allow farmers to access savings, credit or insurance more conveniently and cheaply. Note that farmers were concerned about sharing their income information with a lender for fear it would get to the government and increase taxation or reduce welfare support. Credit scoring using psychometric data could be a good fit for farmers as it relies on personality profile data created at the time of assessment rather than existing financial data.

Read the full report

Contact us for more info on LenddoEFL’s credit assessment

Blog | Raising the Stakes on Psychometric Credit Scoring

An updated and expanded 2nd edition (first edition)

Why read this post?

Learn why high-stakes data is essential for building accurate credit-scoring models.


Introduction

Billions of people lack traditional credit histories, but every single person on the planet has attitudes, beliefs, and behaviors that can be used to predict creditworthiness. Quantifying these human traits is the focus of psychometrics, and the alternative data provided by this technique allows LenddoEFL to greatly expand financial inclusion in its mission to #include1billion.

But there is a catch: in order to build models that accurately predict default, applicants need to complete psychometric assessments in pursuit of actual financial products, a so-called “high-stakes” environment. This is because people answer psychometric questions differently when they have a chance to receive a loan (the high stakes) than they would in a hypothetical situation with no incentive (the low stakes).

Despite this fact, psychometric tools are frequently built using low-stakes data. For example, many companies develop psychometric credit scoring tools using volunteers. And many lenders want to validate psychometric credit scoring tools on their clients through back-testing: giving the application to existing clients and comparing scores to their repayment history, again a low-stakes setting.


These approaches are only valid if low-stakes data can be applied to the real world of high-stakes implementation, where access to finance is on the line for applicants. But it turns out that this is not the case. A recent study published by our co-founder Bailey Klinger and academic researchers proved that low-stakes testing has no predictive validity for building and validating psychometric credit scoring models in a real-world, high-stakes situation. The data below shows exactly how applicant responses shift as they move from one environment to another.


The Experiment

To test for differences between low- and high-stakes situations, LenddoEFL gathered psychometric data from two sets of micro-enterprise owners in the same east-African country. One group already had their loans (low-stakes) and another group completed a psychometric assessment as a part of the loan application process (high-stakes).

First, the low-stakes data. The figure below shows the frequency distribution for two of the most important ‘Big 5’ personality dimensions for entrepreneurs, Extraversion and Conscientiousness, as well as a leading integrity assessment[i].
 

image1.png


You can see that when the stakes are high, people are answering the same questions very differently. The distribution of scores on these three personality measures shifts significantly to the right. When something important is at stake, like being accepted or rejected for a loan, people answer differently.

How do these differences in low- vs. high-stakes data matter for credit scoring?

To see how these differences impact the predictive value of psychometric credit scoring, we can make two models[ii] to predict default: one uses responses from applicants that took the application in low stakes settings, and the other uses responses from applicants that were in high stakes settings. Then we can use a Gini Coefficient—which measures the ability of a model to successfully rank-order applicants’ riskiness and for which a higher coefficient is a metric of success in this—to compare each model’s ability to predict default for the opposing population as well as its own.[iii]

image2.png


These results clearly show that there is a significant change in the rank ordering when models built on low-stakes data are applied in high-stakes settings and vice versa.[iv] Importantly, we can see that a psychometric credit-scoring model can indeed achieve reasonable predictive power in a real-world, high-stakes setting. But, that is only when the model was built with high-stakes data.

Think about it like this: when the stakes are high, both less and more risky applicants change their answers. But, less risky applicants change their answers in a different way than riskier applicants. This difference is what is used to predict risk in psychometric credit scoring models: the difference between how low- and high-risk people answer in a high-stakes setting.

This also illustrates why we see that a model built on low-stakes data is ineffective in a real-world high-stakes implementation. In the low-stakes setting, the low- and high-risk people aren’t trying to change their answers, because they aren’t concerned with the outcome of the test. Once the stakes are high, however, this pattern changes.


Conclusions

Testing existing loan clients or volunteers has an obvious attraction: speed. That way you don’t have to bother new loan applicants with additional questions, and then wait for them to either repay or default on their loans before you have the data to make or validate a score, an approach that takes years.

Unfortunately, these results clearly show that this shortcut does not work. People change their answers when the stakes are high, so a model built on low-stakes data falls apart when used in the real-world. People answer optional surveys with less attention and less strategy than they do a high-stakes application, and therefore the only strong foundation to a predictive credit-scoring model is real high-stakes application data and subsequent loan repayment.

Consider an analogy: you can’t predict who is a good driver based on how they play a driving video game, where the outcome is not important. Conversely, someone who does well on a real-world driving test may not perform that well on a video game.  Whether it is driving skills or creditworthiness, you must predict the high-stakes context with high-stakes data.


TAKEAWAYS:

- Psychometric model accuracy is only guaranteed when you collect data in a high-stakes situation (i.e., a real loan application).

- Despite its speed, back-testing a model on existing clients in a low-stakes setting is risky because it might not tell you anything about how the model will work in a real implementation.

- If you want to buy a model from a provider, the first thing you should verify is what kind of data they used to make their model. Was it from a real-world high-stakes implementation similar to your own?


[i] These are indices from widely available commercial psychometrics providers. It is important to note that LenddoEFL no longer uses any of these assessments or dimensions in our assessment, nor any index measures of personality.

[ii] Stepwise logistic regression built on a random 80% of data, and tested on the remaining 20% hold-out sample. An equivalently-sized random sample was used from the other set (high-stakes data for the low-stakes model, and low-stake data for the high-stakes model) to remove any effects of sample size on gini.

[iii] Note that this exercise was restricted to those questions that were present in both the low- and high-stakes testing. It does not represent LenddoEFL’s full set of content and level of predictive power, it is only for purposes of comparing relative predictive power.

[iv] The results also show that using standard personality items, the absolute predictive power is lower in a high-stakes setting compared to a low-stakes setting. This is likely because of the ability to manipulate some items in a high-stakes setting makes them not useful within a high-stakes setting. This lesson has lead LenddoEFL to develop a large set of application content that is more resistant to manipulation and which has much higher predictive power in high-stakes models. This content forms the backbone of the current LenddoEFL psychometric assessment, all of which is built and tested exclusively with high-stakes data and subsequent loan repayment-default rather than back-testing.


Financial Services Veteran, Ray Ferguson, Joins LenddoEFL’s Board

Ferguson’s wealth of experience across banking, insurance and venture capital in Asia makes the appointment a strategic addition for the growing fintech company

LenddoEFL, whose credit score, verification and consumer insights help leading banks across emerging markets make data-driven decisions, is proud to welcome financial services industry veteran, Ray Ferguson, as a new member of its board. Ferguson is co-founder and Managing Partner of Caber Partners, former Regional CEO, SE Asia at Standard Chartered Bank, and currently chairs the boards of digital life insurance company, Singapore Life, and e-money software platform, Youtap. 

Read complete press release.

DSC_2351.jpg

Blog | Can behavioral traits help financial institutions assess creditworthiness?

davide-ragusa-24118-unsplash.jpg

Despite progress in financial inclusion, 1.7 billion people still lack access to a bank account . And globally, only 11% of people over 15 borrow from a financial institution. This lack of access to credit is problematic for livelihoods, economic development, and much more.

Credit scoring is quickly evolving in favor of greater financial inclusion. At LenddoEFL, we spend 110% of our time thinking about ways to understand someone regardless of credit history or collateral. We pull together the best new sources of opt-in alternative data that applicants can choose to share so that we can assess creditworthiness and verify identities.

One of our sources of data is behavioral and psychometric data. Read this article published in Social Innovations Journal by Javier Frassetto, our Chief Risk and Analytics Officer, to learn how it works: what traits predict creditworthiness, how do we measure them, and how do we prevent gaming.
 

Find out how behavioral traits predict creditworthiness